

Understanding Crypto Chart Patterns with Free PDF Guides
Discover key crypto chart patterns to read market trends and make informed trades 📈. Get practical tips and free PDF resources to sharpen your skills today 📖.
Edited By
Henry Wilson
Price action chart patterns are an essential part of technical analysis for traders and investors in Pakistan. These patterns reveal market psychology and help predict price movements based on historical price data alone, without relying on indicators. Understanding them allows you to make smarter decisions in volatile markets like the PSX or commodity exchanges.
At its core, price action analysis examines the movement of price itself, focusing on swings, breakouts, and consolidations. Patterns form when prices behave in repetitive ways, often reflecting emotions like greed or fear among market participants. Recognising these patterns provides clues about whether the market is likely to continue, reverse, or pause.

Some common examples include head and shoulders, double tops and bottoms, flags and pennants, and triangles. For instance, the head and shoulders pattern suggests a potential trend reversal. If you see this in a PSX stock chart, it may signal that the upward trend will end and a downward phase could begin.
Understanding the formation and context of each pattern is key — relying on pattern shape alone can lead to false signals.
In Pakistan’s markets, combining price action patterns with local factors such as macroeconomic news, regulatory changes from SECP, or currency fluctuations can improve accuracy. For example, a breakout from a triangle pattern might gain more significance if announced alongside a change in SBP’s monetary policy.
Traders should be cautious about 'noise'—random price movements that obscure patterns. It’s better to confirm patterns using volume or time filters to reduce mistakes.
To help readers sharpen their expertise, we have prepared an exclusive PDF resource summarising key chart patterns with annotated examples from Pakistani stocks and commodities. You can use it to practise spotting patterns on your charts and enhance your entry and exit strategies.
In short, mastering price action chart patterns gives you an edge by making sense of price swings and market behaviour. Whether you’re trading equities, forex, or commodities in Pakistan, these insights provide practical tools to spot opportunities and manage risks better.
Price action trading focuses on analysing the raw movement of price over time, without relying heavily on lagging indicators. Understanding this approach is essential because it helps traders read the market as it unfolds, rather than reacting to past signals. By studying price action, you gain insight into market sentiment and the battle between buyers and sellers, which is particularly helpful in volatile markets like Pakistan’s stock or forex markets.
Chart patterns build on price action by revealing consistent shapes and formations that often precede significant price moves. Recognising these patterns equips traders with practical clues to make smarter entry and exit decisions. For example, the head and shoulders pattern often signals a trend reversal, allowing traders to anticipate market turns before they happen.
Definition of price action: Price action trading involves observing the price movements reflected on charts without relying on external indicators. Traders watch patterns in candlesticks, support, and resistance levels to interpret market behaviour. This method strips down technical analysis to its core, focusing purely on how price reacts to different forces, which makes it quite flexible and adaptable.
For instance, when a candlestick forms a long wick at a support level, it shows rejection of lower prices—an immediate signal that demand may be rising. Such signals help traders make informed decisions without clutter from technical indicators.
Importance in technical analysis: Price action provides the foundation of most technical analysis because price itself reflects all market information, including fundamentals and trader psychology. In markets where news impacts price quickly, like Pakistan’s KSE 100 Index or currency market, relying on price action helps you stay grounded in the current conditions.
Unlike indicators that may delay signals, price action shows what market participants are doing right now. This immediacy improves timing when opening or closing trades.
Comparison with indicator-based trading: Indicators such as RSI or moving averages depend on historical price data and often lag behind actual price changes. They can sometimes give conflicting signals or fail in choppy markets. Price action, conversely, reacts instantly to price movements, offering a clearer and more direct perspective.
That said, many traders combine price action with indicators for confirmation. But understanding price action alone is a crucial skill, especially when indicators behave unpredictably during volatile periods, like political uncertainty in Pakistan.
Role of chart patterns in decision making: Chart patterns work as shortcuts to understanding price behaviour without analysing every candle. Familiar patterns, such as triangles and flags, help traders anticipate continuation or reversal of trends. For example, spotting an ascending triangle suggests buyers are gaining strength, signalling a potential breakout.
These patterns also aid in setting realistic price targets and stop-loss levels, improving risk management and increasing confidence in trade setups.
How patterns reflect market psychology: Patterns emerge because traders react collectively in similar ways to news, greed, fear, or uncertainty, forming repetitive price shapes. A double top pattern, for example, shows that buyers tried twice to push prices higher but failed, indicating weakening demand and potential selling pressure.
These visual cues reveal the tug-of-war between bulls and bears, helping traders gauge sentiment shifts early. Recognising this human element in charts is key to making trades that align with the crowd’s psychology rather than against it.
Understanding price action and chart patterns opens the door to reading markets more clearly, making trading decisions based on real-time behaviours, not just theoretical signals.
In summary, mastery over price action and chart patterns offers traders in Pakistan and elsewhere a practical approach to navigate market ups and downs, improving timing and boosting confidence in their trades.
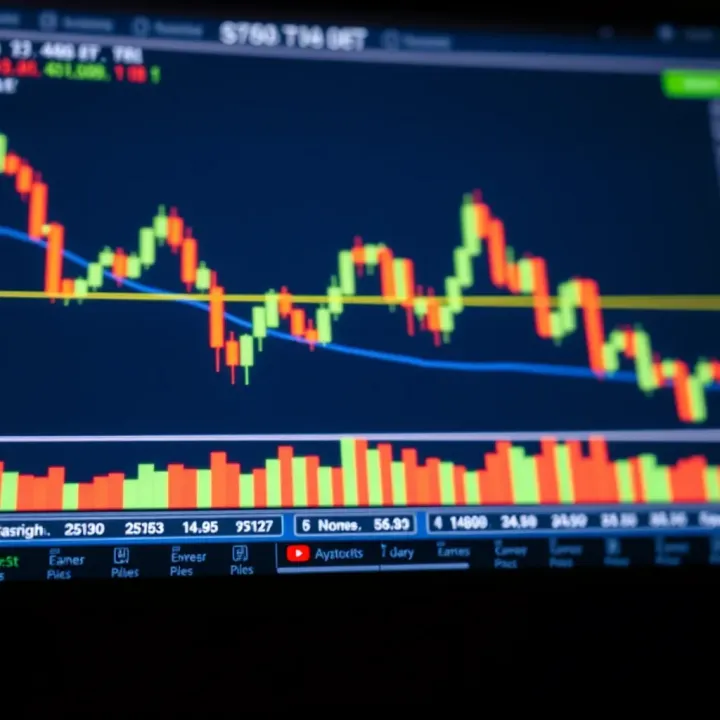
Price action chart patterns are essential tools for traders to interpret market behaviour without relying on lagging indicators. Understanding these patterns can improve your ability to predict market turns and continuations, which is especially useful in volatile markets like Pakistan's. This section breaks patterns into two broad groups — reversal and continuation — each offering actionable insights.
Head and Shoulders
This classic reversal pattern signals a shift from an uptrend to a downtrend or vice versa. It consists of three peaks: the middle peak (head) is higher than the two shoulders on either side. When price breaks the “neckline” support, it confirms the reversal. Traders often use this pattern on the PSX or forex charts to time exits or enter short positions, reducing risk during trend changes.
Double Top and Double Bottom
A double top forms when price hits a resistance level twice and fails to break higher, indicating possible bearish reversal. Conversely, a double bottom marks two troughs at support, signalling potential bullish reversal. These patterns are common in Pakistani equity markets during earnings announcements or political events, often followed by sharp trend shifts.
Triple Top and Triple Bottom
Less frequent but stronger than double patterns, triple tops and bottoms occur when price tests the same level three times. Their formation suggests that supply or demand is very strong at those levels, increasing the likelihood of a significant reversal. For example, during the Rupee crisis periods, triple bottom patterns appeared at key support zones, providing good reversal signals.
Flags and Pennants
Flags appear as small rectangles slanting opposite to the prevailing trend, while pennants look like small symmetrical triangles. Both indicate short pauses before the trend continues. Pakistani traders can spot these after big moves in indices or currency pairs, using them to enter new trades with tight stop-loss to capture the next leg.
Triangles (Symmetrical, Ascending, Descending)
Triangles show consolidation phases with different directional biases: symmetrical triangles are neutral, ascending triangles lean bullish, and descending triangles signal bearish tendencies. They help traders in Pakistan's stock or commodity markets anticipate breakouts by watching volume and price squeeze within these formations.
Rectangles
Price moves sideways between parallel support and resistance lines creating a rectangle or range. This indicates indecision or balance between buyers and sellers. Traders often wait for breakout above or below the rectangle to confirm continuation. In Pakistan’s markets, such patterns emerge around key policy announcements causing indecision.
Recognising these price action patterns sharpens your trading decisions by showing when markets pause, reverse, or continue. Combining this with volume and context can improve entry and exit timing significantly.
Understanding these patterns lays a strong foundation for your trading strategies, complementing other technical and fundamental analyses relevant to Pakistan’s financial environment.
Understanding how to identify and apply price action patterns is essential for any trader aiming to make informed decisions in volatile markets. These patterns offer insights into potential market moves without relying heavily on lagging indicators, which can sometimes delay entry or exit decisions. In Pakistan's diverse markets, recognising these patterns helps you align trades with prevailing market psychology and improves timing for better results.
Observing candlestick formations is the first step in recognising price action patterns. Candlesticks display the open, close, high, and low prices within a specific timeframe, forming distinct shapes like pin bars or engulfing candles. For example, a bullish engulfing candle following a downtrend may signal a strong reversal. Paying close attention to these formations allows traders to anticipate shifts before full patterns develop.
Next, drawing support and resistance lines helps frame where price action occurs repeatedly. Support marks levels where buying pressure prevents further price drops, while resistance indicates selling pressure capping price rises. In Pakistan’s equity markets or forex trading, trends often bounce between these levels. Drawing these lines clearly lets traders spot breakout or reversal zones, which are critical in confirming pattern setups.
Confirming pattern validity involves cross-checking with additional signals like time duration and the pattern’s proportion. For instance, a head and shoulders pattern requires a clear left shoulder, head, right shoulder, and a neckline break confirmation. Without this confirmation, trading purely on partial pattern appearances increases risk. Checking multiple factors reduces false signals and improves trade quality.
Entry and exit points hinge on pattern completion and confirmation. Traders often enter a trade when price breaks above resistance or below support that defines the pattern. For instance, buying right after a triangle breakout with a retest can limit downside risk. Exits usually align with previous support or resistance zones or a predefined target based on pattern size.
Risk management and stop-loss placement are critical to protect your capital. Placing stop-loss orders just beyond pattern extremities—like below a pattern’s low in an uptrend—limits loss if the trade fails. Managing risk smartly ensures you stay in the game longer, especially in Pakistan’s sometimes unpredictable market environments driven by political or economic shifts.
Finally, using patterns alongside volume analysis adds a reliable layer of confirmation. Volume spikes during breakouts reinforce the likelihood of a genuine move, while weak volume suggests caution. For example, a breakout on the Pakistan Stock Exchange (PSX) with rising volume signals strong conviction. Combining volume with price patterns sharpens entry timing and decreases false breakout risks.
Mastering price action patterns means blending visual clues, confirmation methods, and risk controls. This practical approach helps traders react swiftly and confidently amid Pakistan’s fast-changing markets.
Price action chart patterns alone do not guarantee success; adapting them to the unique conditions of the Pakistani market is essential. Local factors like volatility, news impact, and trading hours can greatly influence how these patterns behave in practice. By understanding these elements, traders can fine-tune their decisions and manage risks better.
The Pakistan Stock Exchange (PSX) often shows increased volatility compared to more mature markets. Sharp price swings can result from lower liquidity and sudden reactions to news. This means a classic chart pattern like a double top might break faster or produce false signals. Traders should therefore consider widening stop-loss levels and focus on confirmation signals such as volume spikes before entering trades.
News events frequently rattle Pakistani markets—economic data releases, budget announcements, or political developments can trigger sudden price movements. For example, during election seasons, a pattern that looks like a breakout might reverse quickly as uncertainty grows. Monitoring news alongside chart patterns helps traders avoid getting caught on the wrong side of volatile moves.
PSX’s trading hours from 9:30 am to 3:30 pm PKT see varying liquidity. Early and late hours tend to have lower volume, which can distort pattern reliability. The middle hours, especially after 11 am, generally provide more stable data. Therefore, it’s wise to validate patterns during peak activity periods to reduce false signals caused by thin trading.
Pakistani traders often rely on internationally recognised platforms like TradingView and MetaTrader 5 for their advanced charting capabilities and access to a wide range of indicators. Some local brokers also offer proprietary platforms equipped with real-time PSX data. Using these tools helps in accurate drawing of support and resistance levels and spotting price action patterns effectively.
Structured PDF guides are valuable for offline study and reference. Websites of leading Pakistani trading educators and platforms such as Pakistan Mercantile Exchange’s education section or trader communities often publish updated PDFs covering current market patterns. Accessing these resources ensures you stay aligned with local market nuances.
Apps like PSX Trading App, EasyTrade by Easypaisa, and apps from local brokers enable chart viewing and pattern recognition on the go. These convenient tools let traders monitor price action throughout the day, even during commutes or breaks. Having such apps helps maintain real-time awareness and quick decision-making.
Understanding these practical tips can significantly improve your trading outcomes by aligning technical knowledge with Pakistan’s market realities. Always combine chart patterns with local insights for the best edge.
Remember to monitor major political and economic updates alongside your technical analysis.
Use robust platforms that provide reliable data for Pakistani securities.
Observe patterns during peak trading hours to avoid misleading signals from thin liquidity.
Having a dedicated PDF resource on price action chart patterns can be a game-changer for traders who want to refine their technical analysis skills. PDFs serve as a compact, comprehensive guide that you can refer back to whenever needed. Unlike scattered articles or videos, a well-structured PDF consolidates key chart patterns, definitions, and examples in one place. This helps you make faster connections between theory and live market conditions.
PDFs offer a clear learning path, which is crucial when tackling something as detailed as price action patterns. Instead of jumping between different web pages or videos, a PDF lays out concepts in a logical sequence. For example, it may start with basic reversal patterns, then move on to continuation patterns with annotated charts, making it easier to digest. Having structure reduces confusion, especially for beginners trying to build confidence in pattern recognition.
One of the biggest perks of PDFs is the ability to print and study offline, a benefit that often gets overlooked. Many traders in Pakistan face frequent internet disruptions or loadshedding. A printed guide or a saved PDF on your device means you can keep learning even without connectivity. Perhaps you want to review patterns over a cup of chai at your favourite dahaba or during a commute — PDFs make this flexible learning possible.
When searching for PDFs, rely on reputable websites and professional trading courses that specialise in technical analysis. Well-known platforms often update their materials to reflect current market behaviour, adding value beyond generic pattern charts. Pakistani traders should consider courses tailored to our markets, where volatility and economic factors differ from global markets. This ensures patterns aren’t just textbook examples but practical tools.
Local experts have an edge because their guides incorporate regional market nuances, including effects of political news and specific trading hours of Pakistani exchanges. PDFs created by respected Pakistani traders often include case studies from PSX (Pakistan Stock Exchange) showing how certain patterns played out in our context. Accessing such resources adds practical depth, bridging global theory with local realities.
A good price action PDF combines structured lessons, offline usability, and trusted content—making it an essential companion for serious traders in Pakistan aiming to spot reliable market signals.
By using and regularly updating your PDF resources, you can sharpen your price action skills steadily, building a solid foundation for confident, informed trading decisions.
Discover key crypto chart patterns to read market trends and make informed trades 📈. Get practical tips and free PDF resources to sharpen your skills today 📖.

📚 Learn to spot and use trading patterns with expert tips and trusted books & PDFs. Improve your technical analysis and trade smarter today! 📈

📈 Explore key trading patterns, their significance, and how to use them effectively. Get exclusive PDF guides tailored for Pakistan's traders. 📊

📈 Discover how to spot and use trading chart patterns with a practical PDF guide. Perfect for Pakistani traders wanting clear, reliable strategies for success.
Based on 14 reviews